Everything posted by rathorebc
-
REVIEW INVITATION : Awakening the Sleeping Giant: Rediscovering Archimedes' Density Method for Fingerprinting of Multicomponent Alloys
Dear @John Cuthber, This entire analysis was done with the following Metal Densities: Au:19.32, Ag:10.5, Cu:8.96. If you are saying that the density used for silver is wrong, that's fine, it can be changed to 10.49 but then it will change all the resultant compositions accordingly. Still, it will identify pure Silver, no problem with that! I was wondering why 10.49 was asked all of a sudden. This makes more sense based on the gold copper additions you were proposing to get back to the density of silver with a different composition. What you propose is definitely correct that there are multiple compositions that share same densities in the continuum that is Iso-pycnic Region, but the moment it is discretized, it shows different behavior allowing DDS to pinpoint the composition. To your question regarding the DDS excluding any other composition produced for a given density, I would like to reiterate that: 1) The remaining compositions produced using the equation are probable compositions (in the continuum, there are infinite of them) and they have non-terminating mass percents as a result or reciprocals in the equation. 2) The termination of the non-terminating numbers produce a deviation ∆D in the alloy density of the remaining compositions (which is completely irrelevant to the functioning of the DDS) 3) If we go back a bit, @sethoflagos mentioned how taking integer combinations will reduce the remaining number of solutions but there will be multiple solutions left still, well, if you take an equation with reciprocals as we have, then your solutions spread out even farther away to the point that their values go out of bounds [0%,100%] which is evident in ternary plot. 4) Now, integer combination as the solution is not the best solution as a composition can have fractional mass percents, and we have found that with this same methodology, fractional mass percents also show unique solution condition in the bounds [0,100]. This is why when we take a random alloy -> compute density using equation -> feed density and the metal densities used in computation to DDS -> we get the same exact resultant alloy back regardless of how many metals there are. This might not be the best solution for this kind of problem or you might think that we manipulated our data, but you can perform your own analysis using our governing equation and you will reach the same conclusions. What you propose is definitely correct that there are multiple compositions that share same densities in continuum, but the moment it is discretized, it shows different behavior allowing DDS to pinpoint the composition.
-
REVIEW INVITATION : Awakening the Sleeping Giant: Rediscovering Archimedes' Density Method for Fingerprinting of Multicomponent Alloys
Dear @studiot, We appreciate your interest in our work and the insightful questions you have raised regarding the effects of sample size, shape, and lattice structure on the precision of density measurements and the Density Decoding System (DDS). Your expertise in chemical analysis and experience with irregular materials bring a valuable perspective to this discussion. Regarding the effect of sample size and shape on density measurements, it is important to recognize that the accuracy and precision of these measurements can indeed be influenced by factors such as the sample's dimensions, geometry, and surface characteristics. In general, larger sample sizes tend to provide more representative density values, as they minimize the impact of localized inhomogeneities or surface effects. However, the optimal sample size and shape may vary depending on the specific alloy system and the measurement technique employed. In our work, we have primarily focused on the theoretical aspects of the DDS and its ability to decode alloy compositions from precise density values. While we have not conducted extensive experimental studies on the effect of sample size and shape, we acknowledge the importance of these factors in practical applications. Future research could explore the relationship between sample dimensions and the accuracy of density measurements, as well as the development of standardized protocols for sample preparation and measurement to ensure consistent and reliable results. Your point about the increasing precision of density measurements and its potential to reveal the effects of lattice structure, impurities, defects, and locked-in stresses is highly relevant. As the resolution of density measurements improves, it becomes possible to detect subtle variations in the alloy's structure that may arise from these factors. This increased sensitivity could potentially allow the DDS to distinguish between alloys with similar compositions but different microstructural features. However, it is important to note that the DDS, in its current form, relies on the assumption of an ideal solid solution and does not explicitly account for the effects of lattice defects, impurities, or residual stresses. These factors can indeed influence the density of an alloy and may introduce deviations from the predicted values based on the constituent elements' densities. As the precision of density measurements increases, it may become necessary to incorporate additional parameters or models into the DDS to capture these effects accurately. Regarding the comparison between the DDS and X-ray fluorescence spectroscopy (XRF), it is important to recognize that these techniques provide different types of information about an alloy. XRF is a powerful tool for elemental analysis, as it can identify and quantify the presence of specific elements in a sample based on their characteristic X-ray emissions. However, XRF does not directly provide information about the alloy's density or the spatial distribution of the elements within the sample. In contrast, the DDS focuses on decoding the alloy's composition based on its precise density value, assuming that the constituent elements are known or can be determined through other means (e.g., XRF or other spectroscopic techniques). The precision of the density measurement required to distinguish between alloys with similar compositions would depend on the specific alloy system and the range of compositions being considered. To determine the limits of the DDS in distinguishing alloys that could be identified by XRF, a systematic study comparing the two techniques would be necessary. This could involve preparing a series of alloy samples with carefully controlled compositions and subjecting them to both density measurements and XRF analysis. By correlating the results from both techniques and assessing the minimum density differences that can be reliably detected, it would be possible to establish the resolution limits of the DDS in comparison to XRF. Such a study would need to consider factors such as the precision and accuracy of the density measurement technique, the sample size and preparation methods, and the sensitivity and resolution of the XRF instrument. Additionally, the choice of alloy system and the range of compositions investigated would influence the outcomes and the ability to distinguish between similar alloys. In conclusion, while we have not specifically studied the effect of sample size and shape on the DDS, we recognize the importance of these factors in practical applications. As the precision of density measurements increases, it may become possible to detect subtle variations in alloy structure arising from lattice defects, impurities, and locked-in stresses. However, further research is needed to establish the limits of the DDS in comparison to other analytical techniques like XRF and to develop standardized protocols for sample preparation and measurement. We appreciate your thought-provoking questions and the opportunity to explore these aspects of our work in greater detail. Your insights have highlighted important areas for future research and have contributed to a deeper understanding of the potential and limitations of the DDS in alloy characterization. Best regards, Dr. B. C. Rathore on behalf of the Research Team
-
REVIEW INVITATION : Awakening the Sleeping Giant: Rediscovering Archimedes' Density Method for Fingerprinting of Multicomponent Alloys
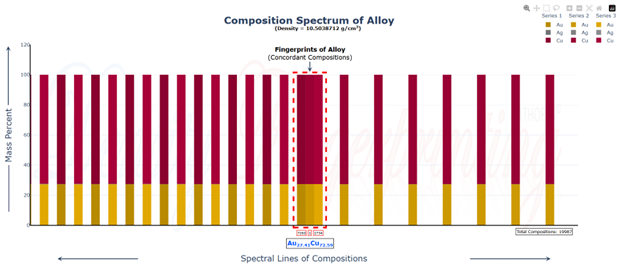
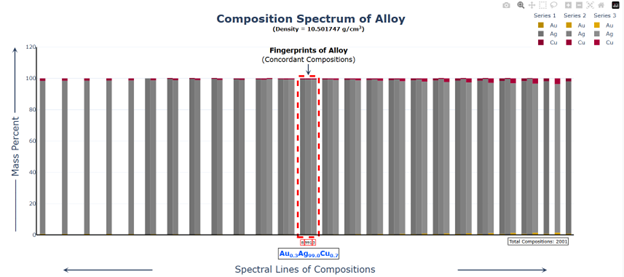
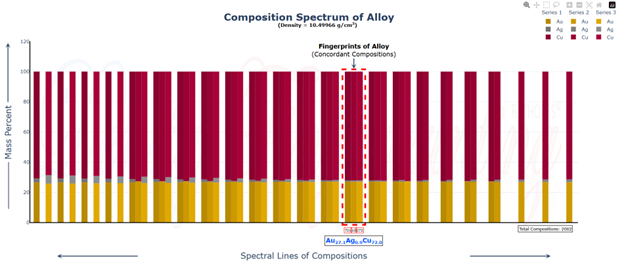
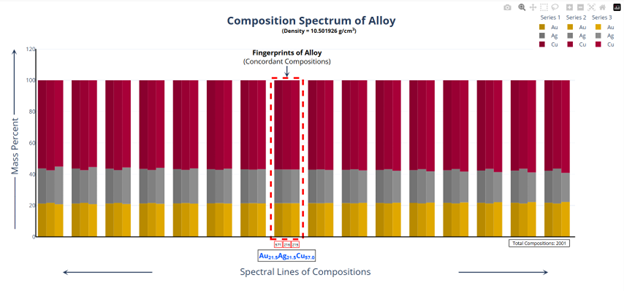
You raised an important question about the capabilities of the Density Decoding System (DDS) in comparison to Archimedes' method. If given only the density of an alloy, such as 10.5, the DDS would indeed identify that the composition lies on the corresponding isopycnic line. In the case of given density 10.5, where the input density matches with density of any constituent, no additional information is required, but in all other cases the accuracy and precision of density plays a crucial role. For instance, in the case of an alloy with a density of 10.5, there are several possibilities: (i) The alloy contains only Ag (ii) The alloy contains both Au and Ag (iii) The alloy contains both Au and Cu (iv) The alloy contains both Cu and Ag (v) The alloy contains all three constituents: Au, Ag, and Cu If the alloy contains only Ag, the DDS would conclusively confirm it as pure Ag. However, in all other cases (ii-v), it is essential to measure the density of the alloy with greater precision and accuracy while simultaneously rechecking and reconfirming the presence of the correct constituents. This is because the presence of other constituents along with Ag conclusively suggests that the alloy is either binary or ternary alloy of Ag. Our studies and findings firmly suggest that each density is fundamentally associated with one and only one composition, and this fact inherently constitutes the density as a genetic code of matter. Our earlier response closely observed that the Isopycnic Region (IR) or Alloy Space (AS) associated with a particular density, such as 10.5, shows the presence of an infinite number of alloys with various accuracies (bearing whole number and fractional compositions) sandwiched linearly between pure Ag at the extreme left and a binary at the extreme right on the Au-Cu axis. However, at an individual level, the density of each alloy, whether binary or ternary, conspicuously exhibits a density difference (∆D) or a deviant behaviour from the density of Ag (10.5). For instance, the following alloys on the IR/AS of density 10.5 explicitly exhibit a fairly deviant behaviour in their individual densities (however small to determine practically, but perceptible), which ultimately facilitates the DDS to decode their correct compositions conclusively: Au27.41Cu72.59 (D=10.5038712); ∆D = +0.0038712 Au27.1Ag0.9Cu72.0 (D=10.49966); ∆D = -0.00034 Au0.3Ag99Cu0.7 (D=10.501747); ∆D = +0.001747 Au21.5Ag21.5Cu57 (D=10.501926); ∆D = +0.001926 Au15.9Ag42Cu42.1 (D=10.50239); ∆D = +0.00239 Thus, for the correct decoding of density into elemental percent composition of an alloy, the DDS requires only two pieces of information: (i) Accurate density with the required precision and accuracy (ii) The presence of constituents in the alloy However, under two circumstances, the knowledge of constituents is not required beforehand: (i) If the constituents present in the alloy are already selected in the DDS (for instance, the density of any combination of compositions from binary to octonary alloys of Au, Ag, Cu, Co, Cd, Ni, Pd, and Zn, including constituents, may be decoded if these metals are preselected in the 8-Metals system of the DDS) (ii) If the DDS is designed for an n-Metals system, no prior knowledge of constituents is required, eliminating the need for all radiation-based supporting technologies to determine constituents. In summary, while the DDS can identify the isopycnic line on which an alloy's composition lies based on its density alone, additional information about the constituents is necessary to pinpoint the exact composition, unless the constituents are preselected in the DDS or an n-Metals system is employed. This sets the DDS apart from Archimedes' method, as it provides a more precise and comprehensive approach to alloy characterization. You have also raised an important point about the CuAuAg system and the potential use of various physical properties to determine the composition of an alloy along the line of iso-density compositions. While properties such as color (reflectance spectrum), electrical conductivity, hardness, speed of sound, melting point, magnetic susceptibility, and electrode potential can provide valuable insights into the composition of an alloy, they often require additional measurements and may not always offer a definitive answer. As previously mentioned by @Mordred, Hume-Rothery Rules provide similar ability to narrow down the constituents, however, it is also not capable of identifying the correct composition of the alloy. In the case of the CuAuAg system, the color of the alloy can give a hint about its composition, as the relative proportions of Cu, Au, and Ag influence the alloy's appearance. However, relying solely on color may not be sufficient to pinpoint the exact composition, especially when dealing with compositions not commonly used in commercial applications, such as 9 or 18 carat gold in the UK or 10 carat gold in the USA. Our Density Decoding System (DDS) addresses this challenge by providing a precise and reliable method for determining an alloy's composition based on its density. By generating Probable Iso-density Compositions (PICs) and analyzing the Concordant Compositions (CCs) across different PIC series, the DDS can identify the True Composition (TC) of an alloy without the need for additional measurements of physical properties. Based on our studies and observations, we firmly believe that the compositional attributes of matter are intrinsically linked to mass, while its structural properties are encapsulated in volume. As a result, density, being the ratio of mass to volume, emerges as a fundamental property of matter that inherently encodes information about its composition. We have pioneered an innovative approach to effectively decode this encoded information from density, establishing it as the genetic code of matter. The DDS leverages the fundamental relationship between density and composition, recognizing that density encodes essential information about the constitution of matter. By treating density as the genetic code of matter and developing a mathematical framework to decode this information, our approach offers a novel and effective way to characterize alloys, even in complex multi-component systems. While the physical properties you mentioned as well as the Hume Rothery rules as suggested by @Mordred can complement the density-based analysis and provide additional validation, the DDS has the potential to streamline the process of alloy characterization and reduce the reliance on multiple measurement techniques. The ability to determine an alloy's composition based on its density alone can have significant implications for materials science, metallurgy, and various industrial applications. We appreciate your insight into the CuAuAg system and the potential use of physical properties to narrow down the composition along the line of iso-density compositions. Your perspective highlights the complexity of alloy characterization and the need for robust and reliable methods, such as the DDS, to address these challenges. Thank you for engaging in this discussion and sharing your thoughts on this topic. Please feel free to correct and guide us, if we are lacking somewhere in order to advance the scientific pursuits. Best regards, Dr. B. C. Rathore on behalf of Research Team
-
REVIEW INVITATION : Awakening the Sleeping Giant: Rediscovering Archimedes' Density Method for Fingerprinting of Multicomponent Alloys
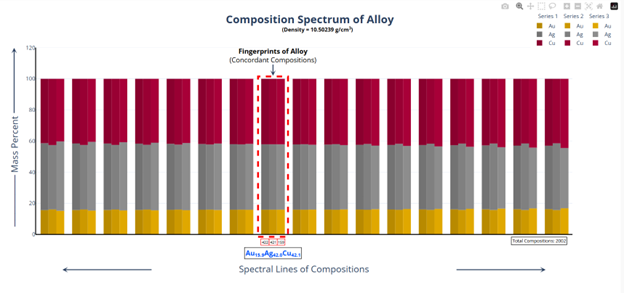
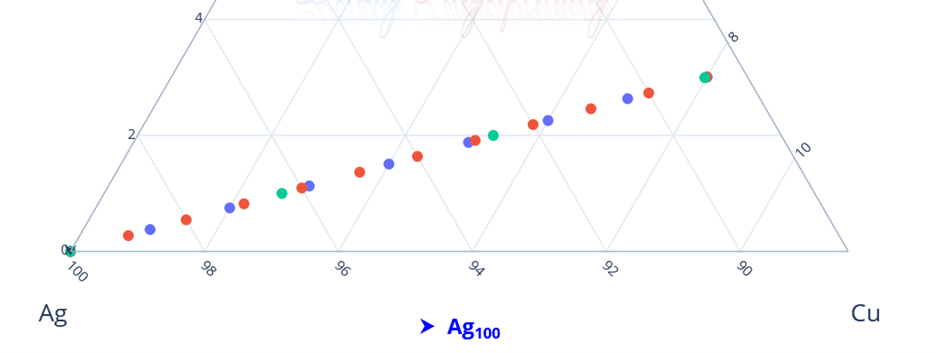
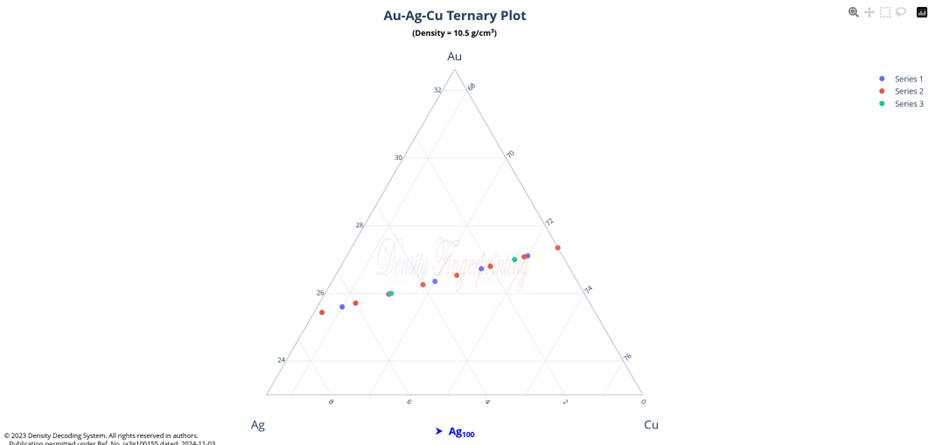
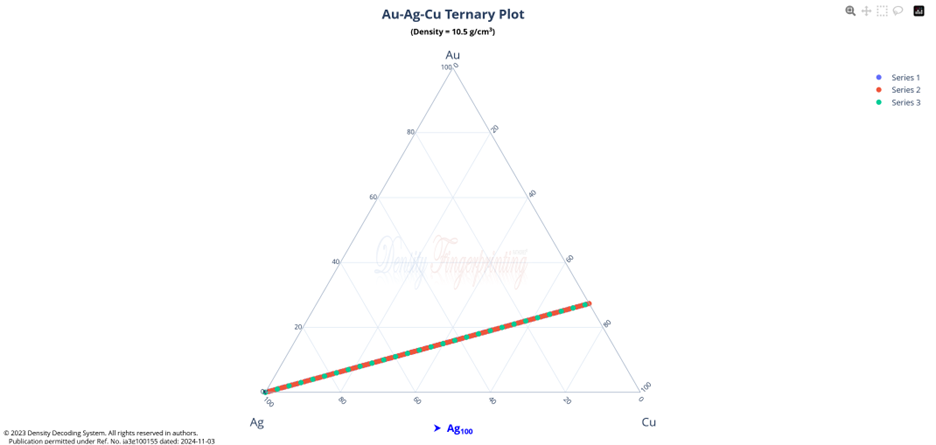
Hi @sethoflagos It is the combination of both; Bounds and Non-terminating decimal expansions that ascertain unique solutions. Of course, it is absolutely correct. Nevertheless, we have not considered this term (specific volume), instead we have emphasized the importance of Density being in denominator as a consequence of the volume additions. As a result, we obtained the correct compositions associated with input densities of non-binary alloys, which would have not been possible. @John Cuthber Thank you for this wonderful question. It is counterintuitive, the way DDS performs, to what is expected from an underdetermined system. Initially, we have defined “match” as a binary alloy of Au (19.32) and Cu (8.96) having density equal to pure Ag (10.5). We have also defined “Light alloy” comprising Cu with little Au and “heavy alloy” comprising Au with little Cu respectively. As per question, we began mixing these “light” and “heavy” alloys with pure silver ‘bit by bit’ in such a manner, so that the overall density of resultant alloy remains intact equal to the density of pure silver (10.5). We wanted to know about the composition of ternary alloys so obtained. We further kept on repeating the mixing of “light” and “heavy” alloys continuously with resultant ternary alloy until its composition reached close to “match” bearing density equal to pure silver (i.e., 10.5). We wished to know the compositions of various alloys obtained during the entire course of mixing process from “pure silver” to the “match”, particularly when all these alloys have same density as that of silver (10.5). To solve this problem, we subjected the density of pure Ag (10.5) as input parameter in Density Decoding System (DDS), initially selected for constituent metals Au, Ag and Cu along with their standard densities 19.32, 10.5 and 8.96 respectively. It was operated at initial (the lowest or ground state) accuracy level i.e., Iterative step (i)=1. This accuracy level visualizes only the whole number compositions of alloys along with their allied compositions of next higher accuracy levels. The DDS, effectively displayed the presence of Ag100 in result along with three discrete PIC series, each one showing presence of Ag100 as Concordant Compositions (CCs), the density spectrum revealing fingerprints of Ag100, the triangular plot of PICs showing the Isopycnic Region (IR) of Ag100 and 2D projection of two PIC series. The detailed results are enclosed as Figure-1. https://densityfingerprinting.github.io/Discussions/Ternary%20Plot%2010.5 The Isopycnic Region (IR) or Alloy Space (AS) of Ag100 obtained at lowest accuracy level (i=1) shows the following trends: (i) It initially shows the presence of pure silver (Ag100) at the vertex of Ag of trigonal plot which extends further in straight line obliquely intersecting the Au-Cu axis and finally terminates constituting a binary alloy of Au27.41Cu72.59. (ii) Just after Ag100, the IR shows presence of very first ternary alloy Au0.3Ag99Cu0.7 and the last (penultimate) ternary alloy with composition Au27.1Ag0.9Cu72.0 before binary alloy. In compositions, the Ag content exhibits a decreasing trend across the IR from pure Ag to binary alloy with increasing Au and Cu contents, which ultimately becomes significantly low and practically vanishes to become untraceable. At higher accuracy levels, i= 0.1 and 0.01, the Ag contents in corresponding penultimate ternary compositions have been recorded being Au27.334Ag0.067Cu72.599 and Au27.35Ag0.005Cu72.645 respectively. (iii) Interestingly, in IR of Ag100, we recorded ternary alloys containing equal amount of Au & Ag (such as Au21.5Ag21.5Cu57) as well as similar amount of Ag & Cu (such as Au15.9Ag42Cu42.1) at density 10.5, equal to pure Ag. (iv) There are, however, infinite number of unique ternary compositions in entire Alloy Space of Ag100 between pure Ag and Au-Cu binary alloy, but only finite number of alloys are visualized at particular iterative step (i). As already stated, that the iterative step (i) intelligently slices the infinite composition space for a given density at its particularly selected accuracy level. For instance, the iterative step (i=1) visualizes only the PIC series associated with whole number compositions, whereas the reducing iterative steps such as i=0.1, 0.01, 0.001, and so on, show the PICs of corresponding higher accuracy levels i.e., accuracy of compositions up to respective decimal places 0.1, 0.01, 0.001, and so forth. At each accuracy level, the iterative step shows finite number of compositions in PIC series without redacting a single composition. The number of PICs at each accuracy level shows exponential increase resulting in higher and higher computational load making the problem NP-Hard. Now, the question arises, how does DDS decode the different alloys of given Isopycnic Region (IR) or Alloy Space (AS) despite identical densities? The Isopycnic Region (IR) or Alloy Space (AS) of a density is actually the composition space, where densities of all unique infinite compositions are identical. In order to experimentally showcase the functioning of DDS, how does it determine the different compositions in an Isopycnic Region (IR), we selected the following compositions of alloys obtained from the IR or Alloy Space of Ag100 and determined their compositions using DDS, initially selected for Au, Ag and Cu constituents along with their standard densities: 1. Au27.41Cu72.59 (D=10.5038712); ∆D = +0.0038712 The composition of Au27.41Cu72.59 for binary alloy may be determined conventionally by Archimedes Density equation being Au= 27.41% and Cu=72.59%. It may also be calculated through DDS for its varied density 10.5038712, which shows a difference ∆D = +0.00387 from density of pure Ag (10.5). On subjecting density D=10.5038712 in DDS as input parameter, selected at iterative step i=0.01, we obtained correct composition of binary alloy of Au27.41Cu72.59 as shown in Figure-2. The interactive fingerprint of this alloy is shown as follows: https://densityfingerprinting.github.io/Discussions/Spectrum%20Plot%20AuCu%20Binary 2. Au27.1Ag0.9Cu72.0 (D = 10.49966) ∆D = -0.00034 On subjecting density 10.49966 in DDS as input parameter, selected at i=0.1, we obtained correct composition of ternary alloy of Au27.1Ag0.9Cu72.0 as shown in Figure-3. The interactive fingerprint of this alloy is shown as follows: https://densityfingerprinting.github.io/Discussions/Spectrum%20Plot%20Last%20Ternary 3. Au0.3Ag99Cu0.7 (D=10.501747) ∆D = +0.001747 On subjecting density 10.501747 in DDS as input parameter, selected at i=0.1, we obtained correct composition of ternary alloy of Au0.3Ag99Cu0.7 as shown in Figure-4. The interactive fingerprint of this alloy is shown as follows: https://densityfingerprinting.github.io/Discussions/Spectrum%20Plot%20of%20first%20ternary%20from%20Ag 4. Au21.5Ag21.5Cu57 (D=10.501926) ∆D = +0.001926 On subjecting density 10.501926 in DDS as input parameter, selected at i=0.1, we obtained correct composition of ternary alloy of Au21.5Ag21.5Cu57 as shown in Figure-5. The interactive fingerprint of this alloy is shown as follows: https://densityfingerprinting.github.io/Discussions/Spectrum%20Plot%20of%20Au21.5Ag21.5Cu57 5. Au15.9Ag42Cu42.1 (D=10.50239) ∆D = +0.00239 On subjecting density 10.50239 in DDS as input parameter, selected at i=0.1, we obtained correct composition of ternary alloy of Au15.9Ag42Cu42.1 as shown in Figure-6. The interactive fingerprint of this alloy is shown as follows: https://densityfingerprinting.github.io/Discussions/Spectrum%20Plot%20of%20Au15.9Ag42Cu42.1 In the last, you have asked the option of extending this (mixing “light” and “heavy” alloys with silver) to have an alloy with, for example, a density half way between that of gold and silver or whatever also exists. When we continued mixing “light” and “heavy” alloys with pure silver, the density lying between Au and Ag (i.e., D=14.91) produced a ternary alloy Au67Ag27Cu6; density between Cu and Ag (i.e., D=9.55) produced Au11Ag2Cu87; whereas the density lying between Au and Cu (i.e., D=14.14) produced Au59Ag34Cu7. The results are enclosed as Figure-7, 8 and 9 respectively. The Isopycnic Regions/Alloy Spaces (IRs/ASs) for alloy compositions obtained from decoding densities D=14.91, 14.14, and 9.55 were found to be parallel to each other and to that of Ag100 with density D=10.5. The main difference was that densities D=14.91 and 14.14 showed Au-Ag and Au-Cu binaries on their corresponding axes, while density 9.55 showed an Ag-Cu binary on the extreme left and an Au-Cu binary on the extreme right. However, all IRs exhibited similar trends to the IR/AS of Ag100 with density D=10.5. The veracity of these results and findings can be conveniently inspected and observed in the interactive graphics by clicking the corresponding links embedded in each image. Comprehensive results obtained from the DDS for the corresponding alloys are enclosed in pdfs from Figures-1 to 9. Remarkably, the DDS effectively exploits differences in alloy densities (∆D) to correctly identify the composition associated with each density, producing a tremendous number of fractional compositions with non-terminating mass percents. The segregation of PICs into different PIC series based on the nC2 combinatorial notation and the interconnectedness of PICs through Concordant Compositions (CCs) play a crucial role in the correct identification of the True Composition (TC) associated with the input density. In the ternary plots shown for any composition, the number of unique PICs in each series is different and equidistant, but not between series. By considering one series as the main scale and another as the vernier scale, the vernier coincidence produced will always be a unique solution representing the coincidence point between the two scales as the correct value. Interestingly, all PIC series collectively show an identical point of coincidence, authenticating the presence of the True Composition (TC) for the input density. For instance, in the ternary plot shown for Ag100, it can be seen that the PICs in each series are equidistant (blue to blue dot or red to red dot or green to green dot) but between the series, they are not (red to next blue etc.). Think about taking any one series as the main scale and the second as vernier scale. The vernier coincidence produced will always be a unique solution representing the coincidence point between the two scales as the correct value. In summary, a subset of underdetermined systems has been found that can be solved in a very particular fashion, as mentioned in the preprint publication. Other concepts discussed include superpositions/superimposition or overlapping of CCs, breaking of asymmetry of composition fractals by perfectly ordered C-bands of CCs, and wave interference patterns shown by PIC series analogous to quantum phenomena. I hope, I was able to address the questions put forth. In case, I missed something or am not clear in explanation, please feel free to reach out to us accordingly. Your kind feedback, comments etc. shall be highly appreciated. Sincerely, Dr. B. C. Rathore on behalf of research team Comments from the team members: “We, the authors, wholeheartedly commend and appreciate this question posed in the form of a beautifully crafted brilliant brain-teaser, which elegantly encapsulates the core challenges our research aims to address, such as the unsolvable underdetermined systems in non-binary alloys, the infinite solutions (probabilities) they generate, and the DDS's ability to conclusively determine the True Composition (TC) from these probabilities for a given input density. This insightful inquiry demonstrates a deep understanding of the complexities in multicomponent alloy characterization and the significance of our novel approach. We are grateful for the opportunity granted by this wonderful forum to engage in a meaningful discussion that further elucidates the key aspects of our work.” Figure-3 AuAgCu (last ternary alloy).pdf Figure-6 Equal parts of Ag-Cu.pdf Figure-1 Pure Silver (10.5).pdf Figure-4 AuAgCu (first ternary alloy).pdf Figure-5 Equal parts of Au-Ag.pdf Figure-2 Au-Cu (Binary alloy).pdf Figure-7 Density between Au & Ag (14.91).pdf Uploading the remaining Figures 8 & 9 Figure-9 Density between Au & Ag (14.14).pdf Figure-8 Density between Cu & Ag (9.55).pdf
-
REVIEW INVITATION : Awakening the Sleeping Giant: Rediscovering Archimedes' Density Method for Fingerprinting of Multicomponent Alloys
Dear @exchemist and @sethflagos, Thank you for your interest in our work and for raising important questions about the concepts we mentioned in our previous post. We appreciate the opportunity to provide more detailed explanations and clarify any confusion. Chromosomal structure of probability distributions: In our analysis of the Probable Iso-density Compositions (PICs) generated by the Density Decoding System (DDS), we observed a striking similarity between the probability distributions of PICs across different series and the structure of chromosomes. Just as chromosomes contain genetic information organized into distinct regions, such as centromeres and telomeres, the probability distributions of PICs exhibit a non-random, structured pattern. Specifically, we found that the true composition of an alloy consistently appears as a highly probable point in each PIC series, reminiscent of the role of centromeres in chromosomes. Centromeres are crucial for the proper segregation of genetic material during cell division, and similarly, the true composition acts as a focal point that connects and aligns the PIC series. This chromosomal analogy provides a framework for understanding the underlying organization and information content of the alloy composition space. Butterfly effect: The butterfly effect is a concept from chaos theory that describes how small changes in initial conditions can lead to large-scale, unpredictable consequences in complex systems. In the context of our work, we observed a phenomenon analogous to the butterfly effect when analyzing the sensitivity of the matched composition to slight variations in the input density. As we incrementally changed the input density, we noticed that the matched composition—the point at which PICs from different series converge—exhibited abrupt shifts at certain critical density values. These sudden changes in the matched composition, despite the small changes in density, are reminiscent of the butterfly effect, where a minor perturbation can trigger a significant alteration in the system's behavior. This finding highlights the intricate and nonlinear nature of the relationship between alloy density and composition, and it underscores the importance of high-precision density measurements for accurate composition determination. Understanding the butterfly effect in this context can guide the development of more robust and reliable methods for alloy characterization and design. Vernier caliper principle in multi-dimensions: The Vernier caliper is a precision measuring tool that uses two scales with slightly different spacings to achieve high accuracy. The principle behind the Vernier caliper relies on the alignment of the two scales at specific points, allowing for precise measurements that exceed the resolution of either scale alone. In our work, we discovered a multi-dimensional analog of the Vernier caliper principle in the convergence of PICs from different series to the true composition. Each PIC series can be thought of as a scale, with the individual PICs representing the markings on the scale. When multiple PIC series are combined, they form a multi-dimensional space where the true composition is located at the point of convergence, similar to the alignment of scales in a Vernier caliper. This multi-dimensional Vernier caliper principle allows us to pinpoint the true composition with high accuracy by leveraging the collective information from multiple PIC series. The convergence of PICs from different series acts as a self-reinforcing mechanism, increasing the confidence in the determined composition. This principle underscores the power of the DDS in navigating the vast composition space and identifying the true composition among numerous possibilities. We hope these detailed explanations provide a clearer understanding of the concepts we introduced and their relevance to our work. We encourage you to explore our recent paper for a more comprehensive discussion of these findings and their implications for alloy characterization and design. Thank you again for your engagement and thought-provoking questions. We value the input and expertise of the scientific community in refining our methodology and advancing our understanding of these fascinating phenomena. Sincerely, Dr. B. C. Rathore and Research Team
-
REVIEW INVITATION : Awakening the Sleeping Giant: Rediscovering Archimedes' Density Method for Fingerprinting of Multicomponent Alloys
Dear @exchemist, Thank you for your candid feedback and for bringing your concerns to our attention. We really appreciate your perspective and the opportunity to address the issues you have raised. First, we apologize for any confusion caused by our use of technical terms such as "Vernier's coincidence, superposition, concordance, and wave-interference patterns." These terms are used in our work to describe specific phenomena observed in the analysis of Probable Iso-density Compositions (PICs) and their relationships within the Density Decoding System (DDS). We will strive to provide clearer explanations and definitions of these concepts to ensure better understanding and avoid misinterpretation. Regarding the use of the term "real-time," we understand your point that the composition of an alloy is a static problem. In this context, "real-time data" refers ‘instantaneously created data of PIC series’, which is computed by the DDS on subjecting input density as an input parameter. It refers to the dynamic nature of the DDS algorithm, which generates and analyzes PICs on-the-fly based on the input density and selected constituent elements. The term is not meant to imply any time-dependent behavior of the alloy itself. We assure you that our work is the result of years of dedicated research and is not generated by an AI program in any manner. The methodology, algorithm, and mathematics used in this research have already undergone rigorous peer review in our previous paper, "Theoretical Optimization of Constitution of Alloys by Decoding Their Densities", published in Materials Letters (Elsevier) in 2007, which has already been cited in several research works. Our published work outlines the fundamental principles of our approach, and our current work builds upon those findings to further explore the dynamics and insights revealed by the DDS. We acknowledge that our explanations may have been unclear or not easily accessible to a broader audience. We will make a concerted effort to present our methodology and findings in a more transparent and understandable manner, focusing on the key aspects of our work and their implications for materials science. We value your expertise and feedback, and we invite you to engage in a constructive dialogue with us. If you have specific questions or require further clarification on any aspect of our work, we would be more than happy to address them in detail. Once again, we appreciate your input and the opportunity to improve our communication and presentation of our research. Sincerely, Dr. B. C. Rathore and Research Team rathorebc@hotmail.com
-
REVIEW INVITATION : Awakening the Sleeping Giant: Rediscovering Archimedes' Density Method for Fingerprinting of Multicomponent Alloys
Dear @Exchemist and @Studiot, Thank you very much for your kind interest in our work and for taking the time to discuss our research. We appreciate your insights and the opportunity to clarify any misunderstandings. To address the confusion regarding our methodology, we want to emphasize that the Density Decoding System (DDS) does not rely on exploring a preserved or stored large database to search for the composition corresponding to an input density. Instead, the DDS automatically creates its own real-time database of multiple series of Probable Iso-density Compositions (PICs) based on the nC2 combinatorial notation, where n represents the number of constituent metals in the alloy associated with the input density. The DDS explores this instantly created real-time database to conclusively determine the correct composition using the principles of Vernier's coincidence, superimposition, concordance, and wave-interference patterns. The determination of the correct composition with an absolute degree of certainty and accuracy from the real-time database of numerous PICs is a significant achievement, unprecedented in the history of materials science. It is crucial to note that the number of PICs in the real-time database increases exponentially in higher-order multicomponent alloys due to the gradual increase in the number of constituent metals and PIC series generated for input densities. For example, the densities of octonary alloys consist of 28 PIC series, and sometimes a single series can contain millions of PICs, leading to an NP-Hard situation in decoding the densities of higher-order alloys. Our work extends the classical Archimedes' density method, which was primarily used merely for qualitative analysis based on the density-composition relationship in binary alloys. We have quantified and extended this relationship further for ternary, quaternary, and higher-order alloys by developing the modified Archimedes' density equations. These equations relate the density of an alloy to the densities and mass fractions of its constituent elements, allowing us to establish a mathematical relationship between composition and density. The DDS effectively tackles the problem of underdetermined systems by first considering mass percentages (M=100), which constricts the alloy space (VAS) to the area in a ternary plot (3-metals), tetrahedral plot (4-metals), and so on. The system then discretizes the composition space and condenses the infinity by slicing it in various increasing accuracy levels, enabling the computation of PIC series based on nC2 combinatorial notation and the identification of the True Composition (TC) through the analysis of Concordant Compositions (CCs). Our research has not only demonstrated the successful identification of alloy compositions up to octonary systems using density alone but has also uncovered fascinating insights into the functioning of the algorithm. We have found evidence of chromosomal structure in the probability distributions of PICs, the manifestation of the butterfly effect stemming from alloy density, perfect order beyond the infinity and the principle of Vernier calliper in multi-dimensions. We hope this clarifies our methodology and addresses any misunderstandings about our work. We invite you to explore our research paper further, as we believe it presents a fascinating and novel approach to alloy characterization and design. Kindly feel free to reach out if you have any questions or require further clarification/information Thank you once again for your kind engagement and the opportunity to discuss our research. Best regards, Dr. B. C. Rathore and Research Team rathorebc@hotmail.com
-
REVIEW INVITATION : Awakening the Sleeping Giant: Rediscovering Archimedes' Density Method for Fingerprinting of Multicomponent Alloys
Dear @studiot, Thank you for sharing the Cu-Ag-Au ternary diagram, which provides a valuable perspective on the relationship between composition and various properties, such as color and immiscibility, in this alloy system. To address your question more directly, let's consider how the Density Decoding System (DDS) would approach the analysis of a Cu-Ag-Au alloy with a specific composition, such as 30% gold, 50% silver and 20% copper by weight (Au₃₀Ag₅₀Cu₂₀). Using the standard densities of the constituent elements (Au: 19.32, Ag: 10.50 g/cm³ and Cu: 8.96 g/cm³ g/cm³), we may calculate the theoretical density of this alloy using the modified Archimedes' density equation: D = (30 + 50 +20) / (30/19.32 + 50/10.50 + 20/8.96) = 11.7 g/cm³ On inputting the calculated alloy density (11.7 g/cm³) as input parameter along with the constituent elements (Au, Ag and Cu) with their respective standard densities, the DDS executes the modified Archimedes Density equations and calculates all possible Probable Iso-density Compositions (PICs) for input density. For calculations, DDS supplies Successively increasing Predefined Imaginary Numerical values (SPIN-values) ranging from 1-100 to the third metal and utilises standard densities of constituent metals to calculate PICs. We have discovered that each density of non-binary alloy essentially consists of multiple PIC series based on nC2 combinatorial notation, where, n denotes the number of constituent metals in multicomponent alloy. It means that each multicomponent alloy consists of at least three distinct PIC Series, each series containing unique PICs. Interestingly, All the PIC series are essentially containing a common PIC, which we regard as Concordant Composition (CC). All PICs in each series constitute probabilities associated with single input density. In hundreds of thousands of cases, we have persistently and precisely observed that all the PIC series of a single input density are interconnected together through a Concordant Composition (CC). Which replicates as CCs during computation of PIC series and appears in each individual series akin to the replication of centromere in chromosome. The corresponding plot of PIC series (trigonal and tetrahedral in case of ternary and quaternary alloys) show convergence (superimposition, Vernier co-incidence, wave interference) in corresponding plots. The point of concordance shows highest probability of being True Composition of alloy, therefore we regard it as Most Probable Composition (MPC) unless conclusively proved being True Composition (TC) This MPC always constitutes True Composition (TC) of input density when the iterative step (i) is set at the correct accuracy level of such composition. In order to conclusively verify the correctness of result, the DDS fine tunes the process by decreasing iterative step to higher accuracy levels, unless the composition shows convergence. This complex process may not be reproduced here in limited space. A pdf copy is enclosed herewith to demonstrate the functioning of DDS exhibiting various steps to decode density (11.7 g/cm³) of Au₃₀Ag₅₀Cu₂₀. In this example, the DDS provides a quantitative determination of the alloy composition based on the density calculation and the PIC analysis. The ternary diagram, on the other hand, offers a graphical representation of the composition space and the expected properties of the alloy at different compositions. The immiscibility dome in the Cu-Ag-Au system, as shown in the diagram, you have shown in query, indicates a region where the alloy may separate into two distinct phases with different compositions. This information is valuable for understanding the microstructure and phase behavior of the alloy, which can influence its properties and performance. While the DDS focuses on the quantitative determination of alloy composition based on density, the ternary diagram provides complementary information about the expected properties and phase behaviour of the alloy at different compositions. Combining the insights from both approaches can lead to a more comprehensive understanding of the alloy system and guide the design and optimization of alloys with desired properties. We appreciate your engagement and the opportunity to discuss the relationship between our DDS and the graphical representation of alloy systems. If you have any further questions or observations, please feel free to share them, and we will be happy to continue the discussion. Dr. B. C. Rathore and Research Team rathorebc@hotmail.com Dcoding density of ternary alloy by DDS.pdf
-
REVIEW INVITATION : Awakening the Sleeping Giant: Rediscovering Archimedes' Density Method for Fingerprinting of Multicomponent Alloys
Dear @studiot, We apologize for any confusion or inconvenience caused by our previous responses. We appreciate your interest in our work and the opportunity to address your question directly. Regarding your suggestion to compare our Density Decoding System (DDS) with a simple ternary system like copper/silver/gold using colorimetry, we believe this is an interesting idea worth exploring. The figure you provided illustrates the relationship between the color and composition of Cu-Ag-Au alloys, which is indeed a well-established method for estimating the composition of these alloys based on their visual appearance. While colorimetry can be a useful tool for qualitative analysis of certain ternary alloys, our DDS aims to provide a more quantitative and generalizable approach for determining the composition of a wider range of alloys, including those with more than three components. The DDS relies on the precise measurement of an alloy's density and the knowledge of the constituent elements' standard densities to compute the Probable Iso-density Compositions (PICs) and identify the True Composition (TC). To directly address your question, let's consider an example of a ternary Cu-Ag-Au alloy with a density of 15.56 g/cm³, as mentioned in our previous response. The DDS would input the alloy density and the constituent elements (Cu, Ag, Au) with their respective standard densities (Cu: 8.96 g/cm³, Ag: 10.50 g/cm³, Au: 19.32 g/cm³). By analyzing the computed PICs and Concordant Compositions (CCs), the DDS would identify the TC of the alloy as Au₇₅Ag₁₅Cu₁₀, indicating a composition of 75% gold, 15% silver, and 10% copper by mass. In this case, the colorimetry method might also provide an estimate of the alloy's composition based on its color. However, the accuracy of the colorimetry method may be limited, especially for compositions near the boundaries between different color regions in the ternary diagram. In contrast, the DDS aims to provide a more precise determination of the composition based on the quantitative measurement of density. Furthermore, the DDS has the potential to be applied to a broader range of alloys, including those with more than three components, where colorimetry may not be applicable or effective. We hope this explanation helps to clarify the relationship between our DDS and the colorimetry method for ternary Cu-Ag-Au alloys. We value your input and the opportunity to engage in scientific discourse. If you have any further questions or suggestions, please feel free to ask, and we will do our best to provide clear and concise answers. Best regards, Dr. B. C. Rathore and Research Team
-
REVIEW INVITATION : Awakening the Sleeping Giant: Rediscovering Archimedes' Density Method for Fingerprinting of Multicomponent Alloys
Dear exchemist, We appreciate your perspective and the opportunity to address your concerns directly in this forum. To provide a simple example of how our Density Decoding System (DDS) works, let's consider a ternary alloy with a density of 15.56 g/cm³, composed of gold (Au), silver (Ag), and copper (Cu). Given: Alloy density: 15.56 g/cm³ Constituent elements: Au, Ag, Cu Standard densities: Au (19.32 g/cm³), Ag (10.50 g/cm³), Cu (8.96 g/cm³) Using the DDS, we input the alloy density and the constituent elements with their respective standard densities. The system then computes the Probable Iso-density Compositions (PICs) using a mathematical framework based on modified Archimedes' density equations. The PICs are organized into three distinct series, each containing the "True Composition" (TC) of the alloy as "Concordant Compositions" (CCs). Through a comprehensive analysis of the PICs and CCs, the DDS identifies the TC of the alloy as Au₇₅Ag₁₅Cu₁₀, meaning the alloy is composed of 75% gold, 15% silver, and 10% copper by mass. Regarding your second point, we acknowledge that the term "encoded" may have caused some confusion. Our intention was to emphasize that the density value, along with the knowledge of the constituent elements and their standard densities, contains sufficient information to determine the alloy's composition. We apologize for any misunderstanding caused by our choice of words. You are correct in stating that the information used to determine the alloy's composition is not solely present in the density value itself but also draws upon the knowledge of the constituent elements and their standard densities. The DDS leverages this additional information along with the alloy's density to compute the PICs and identify the TC. We hope this example and clarification help to address your concerns. If you have any further questions, please feel free to ask, and we will do our best to provide clear and concise answers within the context of this discussion. Best regards, Dr. B. C. Rathore and Research Team rathorebc@hotmail.com
-
REVIEW INVITATION : Awakening the Sleeping Giant: Rediscovering Archimedes' Density Method for Fingerprinting of Multicomponent Alloys
Dear @exchemist, and @studiot Thank you for your thought-provoking kind response to our research. We appreciate your perspective and the opportunity to clarify our findings. While we understand your reservations about the DNA analogy, we kindly request that you thoroughly peruse the contents, results, discussions, and findings explained in detail in our research paper. Our work goes beyond simply comparing density to a genetic code and delves into the intricate relationships between density and elemental composition in alloys. To facilitate a comprehensive examination and validation of our results, we cordially invite you to explore our Density Decoding System (DDS) platform, which is available on preprinted research paper in “supplementary weblinks”. The DDS platform is designed to allow the users to instantaneously generate the results presented in our research paper. By using the DDS platform, you can extensively evaluate and verify the veracity of our data and findings. As mentioned in our paper (Section 3.4.4): "This consistent finding invariably underscores that density is not merely a numerical ratio between mass and volume but encompasses intrinsic fundamental information about the constitution and composition of matter, encoded within this magically unique and extraordinary numerical value. This information can be successfully decoded into elemental percent compositions with absolute accuracy and precision, fairly suggesting that density can be regarded as the genetic code of matter." Furthermore, we encourage you to use the DDS platform to compose imaginary alloys of your own choice using the standard densities provided in the drop-down menu for each element. This hands-on experience will allow you to explore the capabilities of the DDS and gain a deeper understanding of how it decodes alloy compositions from density values. To address your specific request for an example, we kindly refer you to the comprehensive results presented in our paper, particularly in Tables 3, 4, and 5, and Figures 9 through 13. These sections showcase the DDS's ability to accurately determine the elemental compositions of various alloys, including ternary, quaternary, and higher-order alloys, solely based on their densities. We believe that a thorough examination of our research paper and hands-on experience with the DDS platform will provide you with a clearer understanding of our findings and the significance of treating density as encoded information in the context of alloy characterization and design. We greatly appreciate your interest in our work and look forward to engaging in further scientific discourse. If you have any additional questions or concerns after reviewing our paper and exploring the DDS platform, please do not hesitate to reach out. Best regards, Dr. B. C. Rathore and Research Team
-
REVIEW INVITATION : Awakening the Sleeping Giant: Rediscovering Archimedes' Density Method for Fingerprinting of Multicomponent Alloys
Dear @exchemist, Thank you for your insightful question. When we say "treating density as encoded information," we are referring to the inherent relationship between the density of an alloy and its elemental composition. Our research goes beyond simply superimposing knowledge of density limits for given combinations of elements. One of the most significant findings of our work is the discovery of multiple Probable Iso-density Composition (PIC) series interconnected through a "True Composition" (TC) that replicates as "Concordant Compositions" (CCs) across each series. This phenomenon resembles the replication of centromeres during cell division, establishing density as the genetic code for non-living matter. This highlights the fundamental role of information in governing the properties and behavior of matter, as conspicuously affirmed in alloys. Furthermore, our research demonstrates that density is not merely a numerical ratio between mass and volume but encompasses intrinsic fundamental information about the constitution and composition of matter, encoded within this unique numerical value. The Density Decoding System (DDS) developed in our work successfully decodes this information into elemental percent compositions with absolute accuracy and precision, suggesting that density can be regarded as the genetic code of matter. By establishing density as the genetic code for non-living matter and bridging the gap between classical and quantum realms, the DDS represents a paradigm shift in materials science. It provides a powerful tool for combinatorial synthesis and characterization of multi-component alloys, opening up new avenues for materials discovery and optimization, and challenging our understanding of the nature of matter. We hope this clarifies our perspective on treating density as encoded information and highlights the significant insights from our research. If you have any further questions, please do not hesitate to ask. Best regards, Dr. B. C. Rathore and Research Team
-
REVIEW INVITATION : Awakening the Sleeping Giant: Rediscovering Archimedes' Density Method for Fingerprinting of Multicomponent Alloys
Dear Members, It has never been possible to determine the elemental percent composition of multi component alloys of three or more metals from their densities alone using the Archimedes density method. It is because the multicomponent alloys constitute of underdetermined system of linear equations due to exceeding variables than the known values. On the other hand, they are always associated with infinite number of probable compositions, where determining correct composition with absolute certainty is not possible. Our family's 25-year long research journey has led to the development of the Density Decoding System (DDS), a revolutionary advancement in materials science that offers a novel approach to characterizing and analysing multi-component alloys from their densities alone. By extending the Archimedes’ density method to multicomponent alloys and treating density as encoded information, the DDS overcomes the challenges of unsolvable underdetermined system of linear equations, incomputable infinite Probable Iso-density Compositions (PICs), and identifying true compositions in infinite composition space. Our paper, titled "Awakening the Sleeping Giant: Rediscovering Archimedes' Density Method for Fingerprinting of Multicomponent Alloys", is currently under review for publication in a reputed journal and has been published as a preprint on ChemRxiv. The methodology, algorithm, and mathematics used in this research have already undergone rigorous peer review in our previous paper, "Theoretical Optimization of Constitution of Alloys by Decoding Their Densities", published in Materials Letters (Elsevier) in 2007. Our current work has the potential to revolutionize materials characterization and design, with far-reaching implications for various industries. Key insights from our study include: · Coexistence of chaos and order, the butterfly effect, emergence of order from infinity, and fractal nature of the composition space in alloys. · Manifestation of quantum-like phenomena in the classical domain of alloy compositions. · Presence of multiple series of Probable Iso-density Compositions (PICs) interconnected through a "True Composition" that replicates as "Concordant Compositions," resembling centromere replication in chromosomes. · Establishment of density as a fundamental "genetic code" for alloys, opening new avenues for materials design and discovery. To facilitate your review process, we are sharing the following resources: 1. Current research paper preprint: https://doi.org/10.26434/chemrxiv-2024-wxzt9 2. Previous peer-reviewed paper: https://doi.org/10.1016/j.matlet.2006.10.052 Links removed To facilitate a thorough examination and validation of our results, we cordially invite you to visit our DDS platform, which is designed to allow users to instantaneously generate the results presented in our research paper, enabling an extensive evaluation and verification of the veracity of our data and findings. The successful live demonstration at the University of Pennsylvania, USA, on July 26th, 2023, further highlights the significance of our research. We would be incredibly grateful if you could provide your invaluable comments, views, and suggestions to help refine our research and identify areas for improvement. Your expertise and feedback will be instrumental in shaping the future of this work. Please feel free to reach out if you have any questions or require further information. You may also frequently share this communication to your colleagues or other scholars or scholastic community for further examination, evaluation, comments or review of our findings. Thanking you for your time and consideration. We look forward to hearing back from you. Best regards, Dr. B. C. Rathore (On behalf of authors)
-
The Official "Introduce Yourself" Thread
Hi, I am B. C. Rathore from India (District Moradabad; U.P.). I am engaged in decoding the densities of multi-component alloys to determine their elemental percent compositions.

.png.118be3c662632b1dc003f00019f6e1e6.png)
.png.cf8adabcb5d2564c187377636a572f13.png)
